
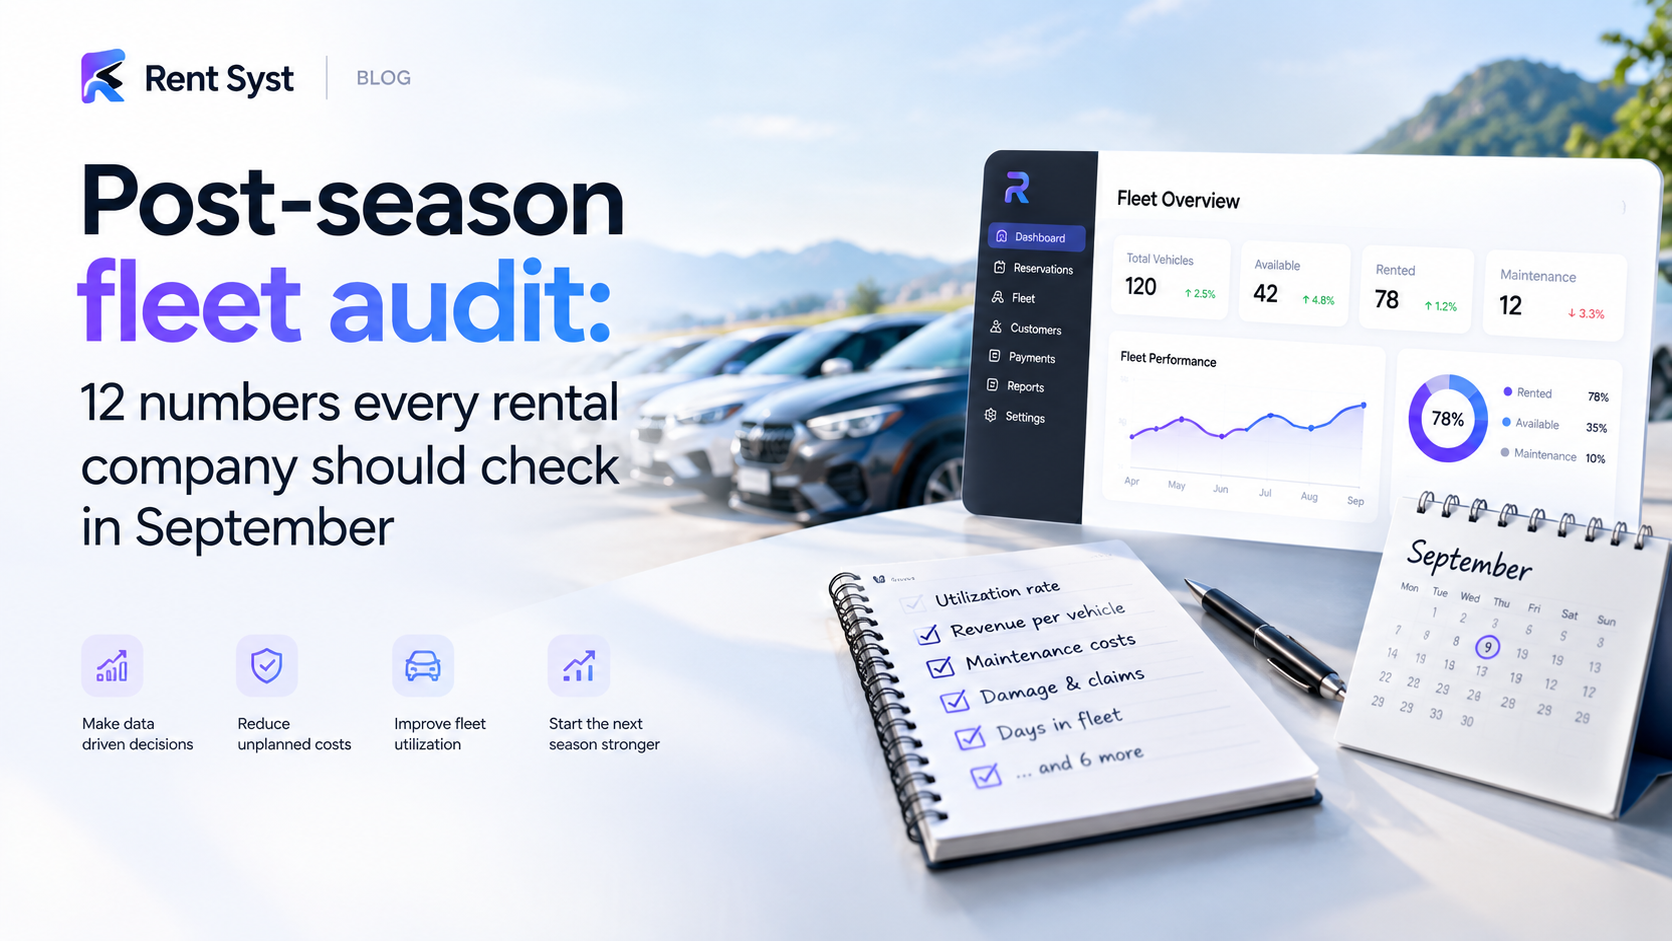
September is the right moment to run the numbers. For rental operators across USA, Spain, Greece, and the UAE, peak season has wound down — and the data sitting in your car rental management system right now is more valuable than it will be in three months. Pull these 12 metrics before the numbers get stale, before staff move on, and before next year’s pricing decisions get made on gut feeling instead of evidence.
Most operators do an annual review in January. By then, the context is gone: you can’t remember why utilization dropped in week three of July, or which channel sent you the most no-shows. September gives you the peak season data while it’s fresh and actionable. You still have time to renegotiate supplier contracts, adjust your fleet size before the next busy period, and fix operational gaps before they repeat.
A structured audit also gives you a baseline. Without one, you’re comparing feelings. With one, you’re comparing numbers.
What it is: The percentage of available vehicle-days that were actually rented out during the peak period.
How to calculate: (Total rented days ÷ Total available days) × 100
A vehicle sitting idle is a fixed cost with no return. Industry benchmarks vary by market, but most well-run operations target 75–85% during peak months. If you’re below 70%, you either have too many vehicles or a booking gap worth investigating. Your fleet management software should surface this per vehicle, not just as a fleet average — averages hide underperforming units.
What it is: Total rental revenue divided by the number of vehicles in your fleet, measured across the peak period.
This tells you which vehicle categories are pulling their weight. A compact might generate less per day but rent more frequently; a premium SUV might sit idle for stretches. Compare revenue per vehicle across categories, not just in total. If a vehicle segment is consistently low, that’s a fleet composition question for next season.
What it is: The mean number of days per completed rental agreement.
Short rentals (1–2 days) create more turnover work and more gap days between bookings. Longer rentals are operationally cheaper per day. If your average rental length dropped this season, check whether your pricing structure is pushing customers toward shorter commitments — or whether a specific channel is sending you day-trippers.
What it is: Total damage repair spend divided by fleet size, for the peak period.
This number often surprises operators when they see it broken down per unit. Some vehicles accumulate damage costs that exceed their rental revenue for the season. Track this alongside the damage deposit recovery rate — how much of repair costs you actually recovered from customers. If recovery is low, your damage inspection process or deposit policy needs attention. See how optimization of car rental business practices can reduce damage-related losses.
What it is: Scheduled and unscheduled maintenance spend per vehicle across the season.
High-mileage peak seasons accelerate wear. Pull the maintenance log and separate scheduled servicing (predictable, budgetable) from unscheduled repairs (a signal of deferred maintenance or vehicle age). Vehicles with high unscheduled maintenance costs are candidates for disposal or replacement before next season — not after.
What it is: The percentage of confirmed bookings where the customer did not collect the vehicle.
No-shows are dead inventory. A no-show on a peak day means that slot was locked, other customers were turned away, and you earned nothing. If your no-show rate is above 3–5%, look at your deposit policy and confirmation process. Some car rental software platforms let you automate reminder sequences that cut no-shows noticeably without manual follow-up.
What it is: The percentage of rentals returned after the agreed time.
Late returns cascade. One vehicle back two hours late can cause a missed handover for the next customer, a complaint, and a refund. Track late returns by vehicle category and by booking channel — some channels attract customers who consistently return late. If your late return rate is above 10%, your grace period policy and late fee structure probably need revision.
What it is: Your utilization rate on your single busiest days, not averaged across the season.
If you hit 100% occupancy on 15 days this summer and had to turn away bookings, that’s a fleet expansion signal. If you never exceeded 80%, you had headroom you didn’t need. This metric helps you size the fleet correctly — adding vehicles is expensive; so is the lost revenue from being permanently sold out during the highest-demand days.
What it is: The breakdown of where your bookings originated — direct website, OTAs, walk-ins, corporate accounts, referrals.
Not all channels are equal on margin. OTA bookings carry commission costs; direct bookings don’t. If 70% of your peak season revenue came through third-party platforms, you’re paying a significant slice of your peak earnings in commissions. The channel mix report in your rental fleet analytics dashboard tells you where to invest in direct booking growth before next season.
What it is: The percentage of customers who rented from you more than once within the past 12 months.
Repeat customers cost less to acquire and tend to book with less friction. A low return rate (below 20% for most markets) suggests either a service quality issue or a lack of retention effort — no follow-up email, no loyalty incentive, no reason to come back. This is one of the most underleveraged metrics in the rental industry.
What it is: Total spend on vehicle cleaning and fuel top-ups divided by fleet size.
This operational cost is often lumped into general expenses and never scrutinised. Break it out per vehicle and you’ll find outliers — vehicles that consistently come back filthy or empty, suggesting a customer segment or channel that doesn’t respect the return conditions. Some operators find that adding a clear, enforced fuel policy (with photographic evidence at collection) cuts fuel recovery costs significantly.
What it is: The number of insurance claims filed as a percentage of total rentals completed.
A rising claim rate affects your insurance premiums the following year — sometimes dramatically. Track claims by vehicle type, customer age group, and booking channel. If claims cluster around a specific segment, you have grounds to adjust your deposit requirements, excess amounts, or acceptance criteria for that group. Your car rental software should let you tag rentals with claim status so this data is queryable, not buried in email threads.
The audit only works if the data is in one place. Operators who track bookings in one spreadsheet, maintenance in another, and damage in a paper log will spend more time compiling the data than analysing it.
A structured car rental management system captures all 12 of these metrics automatically as part of normal operations. RentSyst Ltd. builds its reporting module around exactly this kind of end-of-period review — fleet utilization, revenue per vehicle, damage tracking, and channel attribution are all available without manual data entry.
If your fleet includes more than cars — motorcycles, vans, RVs, or scooters — the same metrics apply. The audit logic for a car rental software for RV fleet or a car rental software for vans operation is identical; only the benchmarks shift.
One non-obvious step most operators skip: after pulling the numbers, schedule a 90-minute session with your ops team before the end of September to walk through each metric together. The data tells you what happened; your team tells you why. That combination is what produces decisions you’ll actually act on.
| # | Metric | Primary question it answers |
|---|---|---|
| 1 | Fleet utilization rate | Are vehicles earning their keep? |
| 2 | Revenue per vehicle | Which categories are most profitable? |
| 3 | Average rental length | Are customers booking short or long? |
| 4 | Damage cost per vehicle | Which units cost more than they earn? |
| 5 | Maintenance cost per vehicle | What needs replacing before next season? |
| 6 | No-show rate | How much inventory was wasted? |
| 7 | Late return rate | Is the handover schedule reliable? |
| 8 | Peak day occupancy | Should the fleet grow or shrink? |
| 9 | Channel mix | Where is margin being lost to commissions? |
| 10 | Customer return rate | Are customers coming back? |
| 11 | Cleaning and fuel spend | Are return conditions being enforced? |
| 12 | Insurance claim rate | Will premiums rise next year? |
If pulling these numbers took you more than a few hours, the bottleneck isn’t the analysis — it’s the data infrastructure. RentSyst is a fleet management software built for rental operators from 15 to 400+ vehicles, with plans starting at €55/month. Reports, damage logs, maintenance records, and channel tracking are all in one place — so next September’s audit takes an afternoon, not a week.
Start with a free trial and have your peak season data structured and ready before the next busy period begins.
Thank you!
Your email has been added to our database. Now you will be the first to receive interesting news about your business.