
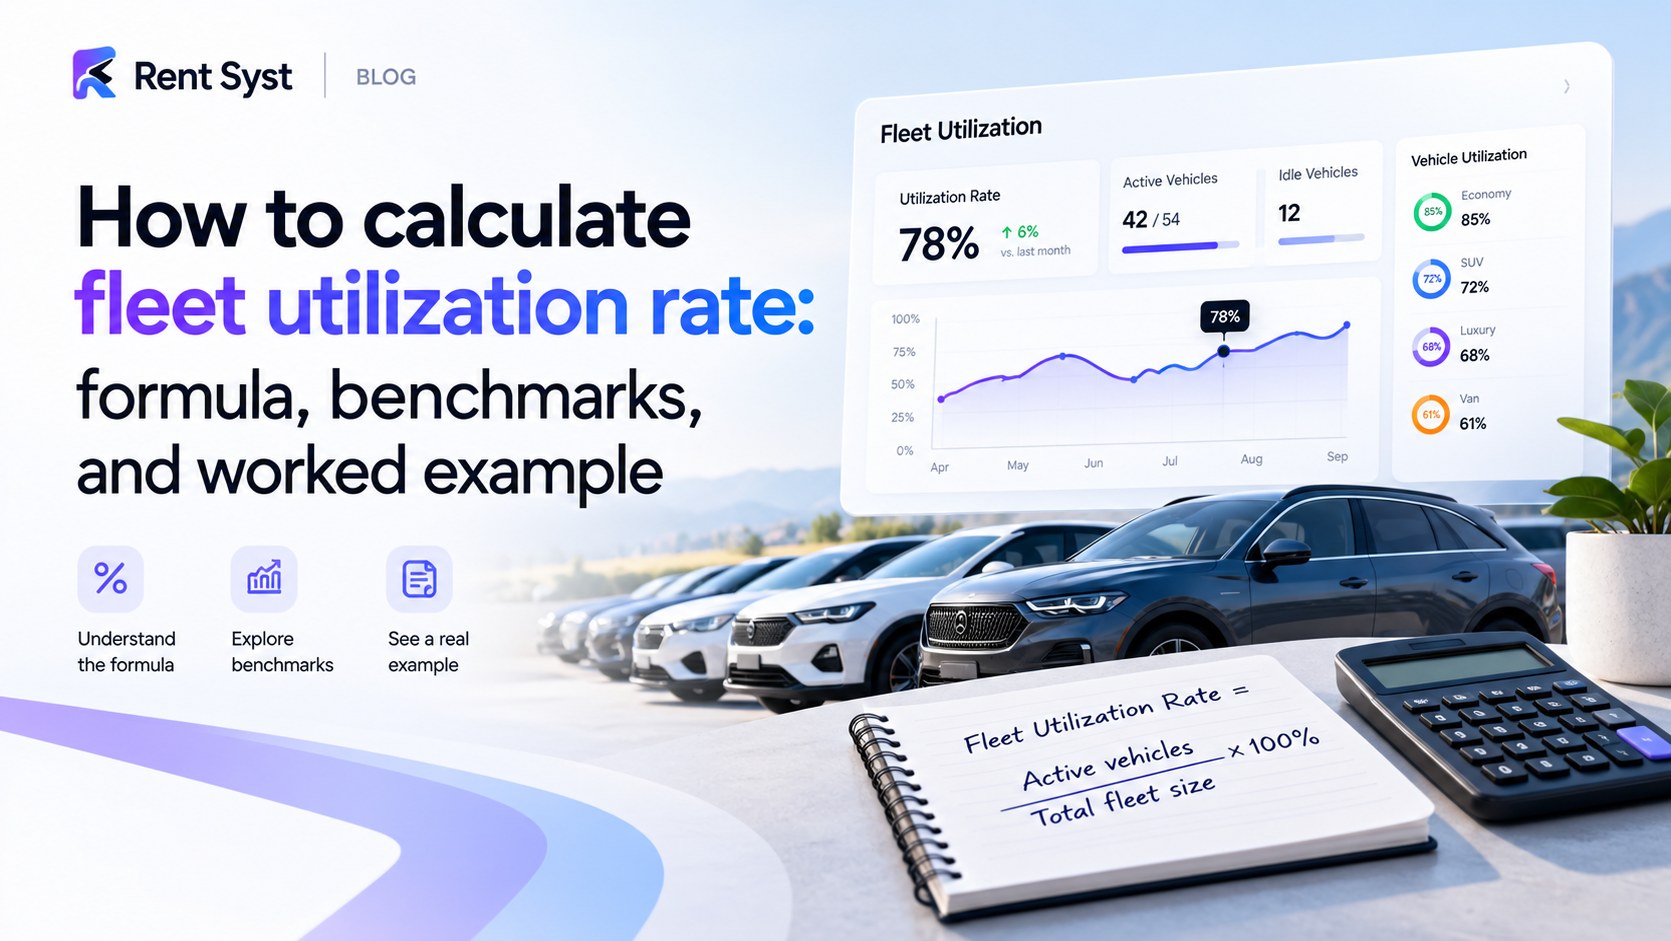
Fleet utilization rate measures how many of your available vehicle-days are actually generating rental revenue. The core formula is straightforward: rented days ÷ available days × 100. For a car rental operator in Europe running a 20-car economy fleet, this single number tells you more about business health than monthly revenue alone — because revenue hides idle assets, and idle assets cost money.
Fleet Utilization Rate (%) = (Total Rented Days ÷ Total Available Days) × 100Total rented days — the sum of days each vehicle was on an active rental contract during the period.
Total available days — the sum of days each vehicle was physically available for rent (not in maintenance, not written off, not reserved for internal use).
The distinction matters. A vehicle sitting in the workshop for five days is not available, so those five days should be subtracted from the denominator. Including them inflates your available-day count and artificially deflates your utilization figure — making a healthy fleet look underperforming.
Let’s run the numbers for a real scenario.
Utilization rate = 392 ÷ 560 × 100 = 70%
That 70% is a solid result for an economy segment fleet. Now compare it to what you’d get if you forgot to subtract maintenance days: 392 ÷ 600 × 100 = 65.3%. The difference is 4.7 percentage points — enough to trigger a wrong pricing or purchasing decision.
Time utilization (the formula above) counts days. Revenue utilization counts money. They answer different questions.
Time utilization tells you whether vehicles are physically occupied. A car rented for 20 days at €20/day and a car rented for 20 days at €80/day have identical time utilization — but very different business outcomes.
Revenue utilization compares actual rental revenue to the theoretical maximum revenue if every vehicle rented at your standard rack rate for every available day.
Revenue Utilization (%) = (Actual Revenue ÷ Maximum Possible Revenue) × 100Where maximum possible revenue = available days × standard daily rate.
Use both metrics together. High time utilization with low revenue utilization signals a pricing problem: vehicles are busy, but rates are too low or discounts are too generous. Low time utilization with high revenue utilization suggests the opposite — premium pricing is holding, but demand isn’t filling the calendar.
For operators looking to improve profitability, not just occupancy, the guide on how to make money on a car rental covers how pricing strategy and fleet mix interact.
Benchmarks vary by vehicle type, geography, and seasonality. The figures below reflect typical ranges for rental operators — treat them as directional, not absolute targets.
| Segment | Typical utilization range | Notes |
|---|---|---|
| Economy cars | 65–80% | High demand, price-sensitive, shorter rentals |
| Mid-range / Standard | 60–75% | Balanced demand, moderate seasonality |
| Premium cars | 50–65% | Longer average rental duration, lower volume |
| Luxury / Exotic | 35–55% | Demand spikes around events and peak seasons |
| Vans & commercial | 55–75% | Business-driven demand, less seasonal |
| RVs & motorhomes | 45–65% | Strongly seasonal, long rental periods |
| Motorcycles & scooters | 40–65% | Highly seasonal, weather-dependent |
A luxury fleet sitting at 45% is not necessarily underperforming — the daily rate compensates. An economy fleet at 45% almost certainly is underperforming, because margins are thin and volume is the lever.
Operators running mixed fleets — cars alongside motorcycles or RVs — need segment-level reporting, not a blended fleet average. A blended number obscures which asset class is dragging performance.
The most frequent error. Every day a vehicle spends in service, awaiting parts, or undergoing mandatory inspection is not an available rental day. Including those days in the denominator makes utilization look worse than it is and can lead operators to over-purchase fleet when the real fix is faster turnaround on maintenance.
A booking that was cancelled or a no-show is not a rented day. Some operators count confirmed reservations rather than completed rentals, which overstates utilization and masks cancellation problems.
Averaging a luxury SUV with a compact hatchback produces a number that describes neither vehicle accurately. Calculate utilization per category, then aggregate if needed.
A monthly figure and a quarterly figure are not directly comparable without annualizing. September in Australia is early spring — demand patterns differ from December. Always specify the period and compare like-for-like (same month, prior year).
Fleet-level tracking hides individual underperformers. One vehicle with chronic mechanical issues can drag the whole fleet’s number while appearing invisible in aggregate data. Vehicle-level records make the problem visible immediately.
Calculating utilization manually across even a 20-car fleet requires pulling rental contracts, maintenance logs, and calendar data — then reconciling them. Across 50 or 100 vehicles, manual calculation becomes unreliable.
Fleet management software automates the data collection: every rental contract, every maintenance event, and every vehicle status change is timestamped. The software calculates utilization per vehicle, per category, and per period without manual input.
RentSyst Ltd. builds this reporting into its fleet analytics module, which means operators see time utilization, revenue utilization, and vehicle-level breakdowns in a single dashboard. For fleets running vans alongside passenger cars, the category-level split is particularly useful — van utilization often moves on a different cycle than car demand.
The platform’s pricing starts at €55/month for fleets up to 15 vehicles and scales per-vehicle as the fleet grows (€3/vehicle/month for 16–50 vehicles, down to €2/vehicle/month for 201–400 vehicles). GPS and telematics data, which feeds directly into availability calculations, is available as an add-on at €2.50/vehicle/month.
Standard utilization formulas treat all available days as equal. They are not.
A vehicle available on a Saturday in peak season has far higher demand potential than one available on a Tuesday in low season. Weighted utilization — where available days are weighted by expected demand — gives a more accurate picture of whether you are capturing the revenue that was genuinely on the table.
The practical version: calculate utilization separately for peak periods and off-peak periods, then compare. If peak utilization is 90% but off-peak is 30%, the problem is not fleet size — it is off-peak demand generation or pricing. If both are low, the fleet is oversized for current demand.
This distinction changes the decision you make. Oversized fleet → consider disposing of assets. Off-peak demand problem → consider dynamic pricing, long-term rentals, or corporate contracts to fill the calendar.
If you are running a rental operation in Australia or any of the other markets RentSyst Ltd. serves — from the UAE to Portugal — and you are still calculating utilization in a spreadsheet, the time cost alone justifies moving to dedicated fleet management software. The numbers are only useful if they are accurate and available when you need them.
Thank you!
Your email has been added to our database. Now you will be the first to receive interesting news about your business.